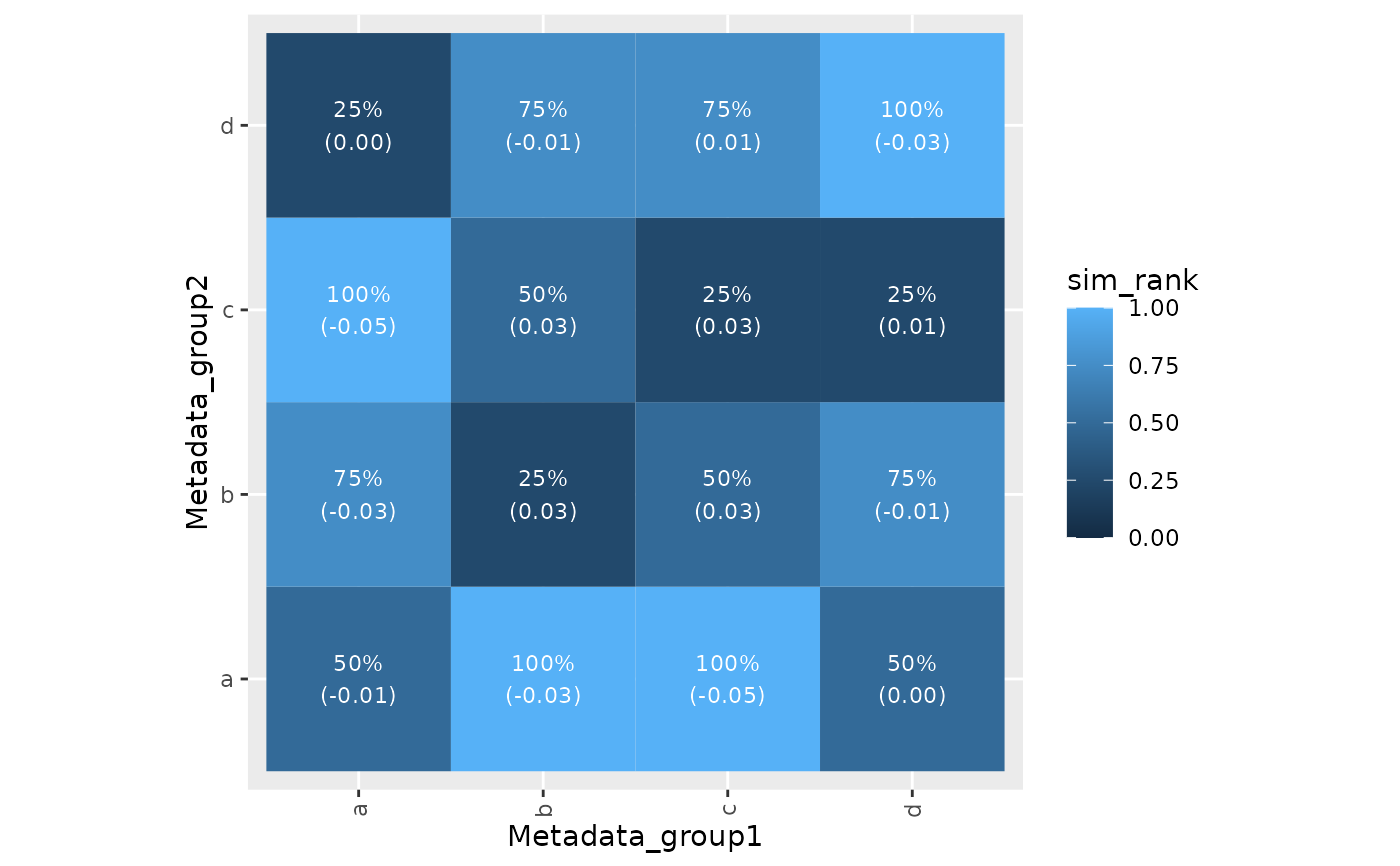
sim_plot plots a melted similarity matrix.
sim_plot(
  sim_df,
  annotation_column,
  calculate_sim_rank = FALSE,
  trim_label = NULL
)
Arguments
- sim_df
data.frame with melted similarity matrix.
- annotation_column
character string specifying the column in
sim_dfto use to annotate rows and columns.- calculate_sim_rank
boolean specifying whether to calculate rank of similarity.
- trim_label
optional integer specifying the trim length for tick labels.
Value
ggplot object of the plot.
Examples
suppressMessages(suppressWarnings(library(magrittr)))
population <- tibble::tibble(
  Metadata_group = sample(c("a", "b", "c", "d"), 100, replace = TRUE),
  x1 = rnorm(100),
  x2 = rnorm(100),
  x3 = rnorm(100),
  x4 = rnorm(100),
  x5 = rnorm(100)
)
annotation_cols <- c("Metadata_group", "Metadata_type")
sim_df <- matric::sim_calculate(population, method = "pearson")
row_metadata <- attr(sim_df, "row_metadata")
sim_df <- matric::sim_annotate(sim_df, row_metadata, annotation_cols)
annotation_column <- "Metadata_group"
matric::sim_plot(sim_df, annotation_column, calculate_sim_rank = TRUE)