CytoTable mise en place (general overview)
This notebook will help you understand the basics of using CytoTable and the biological basis of each step. We provide a high-level overview of the related concepts to give greater context about where and how the data are changed in order to gain new insights.
The name of the notebook comes from the french mise en place:
“Mise en place (French pronunciation: [mi zɑ̃ ˈplas]) is a French culinary phrase which means “putting in place” or “gather”. It refers to the setup required before cooking, and is often used in professional kitchens to refer to organizing and arranging the ingredients …”
import pathlib
from collections import Counter

import pandas as pd
import pyarrow.parquet as pq
from IPython.display import Image, display
from PIL import Image

import cytotable

# setup variables for use throughout the notebook
source_path = "../../../tests/data/cellprofiler/examplehuman"
dest_path = "./example.parquet"
# remove the dest_path if it's present
if pathlib.Path(dest_path).is_file():
    pathlib.Path(dest_path).unlink()
# show the files we will use as source data with CytoTable
list(pathlib.Path(source_path).glob("*"))
[PosixPath('../../../tests/data/cellprofiler/examplehuman/Experiment.csv'),
 PosixPath('../../../tests/data/cellprofiler/examplehuman/PH3.csv'),
 PosixPath('../../../tests/data/cellprofiler/examplehuman/Cytoplasm.csv'),
 PosixPath('../../../tests/data/cellprofiler/examplehuman/Image.csv'),
 PosixPath('../../../tests/data/cellprofiler/examplehuman/ExampleHuman.cppipe'),
 PosixPath('../../../tests/data/cellprofiler/examplehuman/AS_09125_050116030001_D03f00d0_Overlay.png'),
 PosixPath('../../../tests/data/cellprofiler/examplehuman/AS_09125_050116030001_D03f00d0.tif'),
 PosixPath('../../../tests/data/cellprofiler/examplehuman/AS_09125_050116030001_D03f00d1.tif'),
 PosixPath('../../../tests/data/cellprofiler/examplehuman/Nuclei.csv'),
 PosixPath('../../../tests/data/cellprofiler/examplehuman/AS_09125_050116030001_D03f00d2.tif'),
 PosixPath('../../../tests/data/cellprofiler/examplehuman/Cells.csv')]
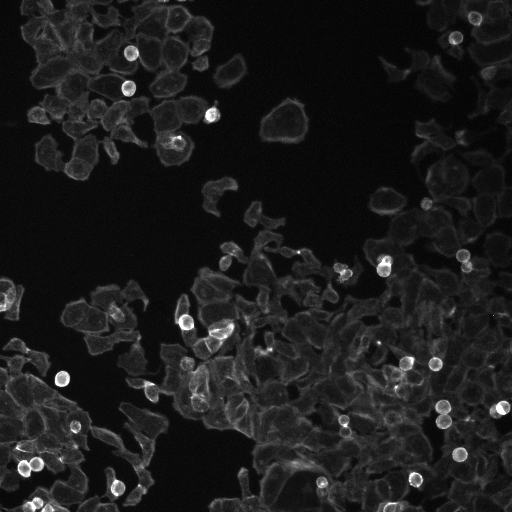
Phase 1: Cells are imaged by microscopes, with optional fluorescence staining
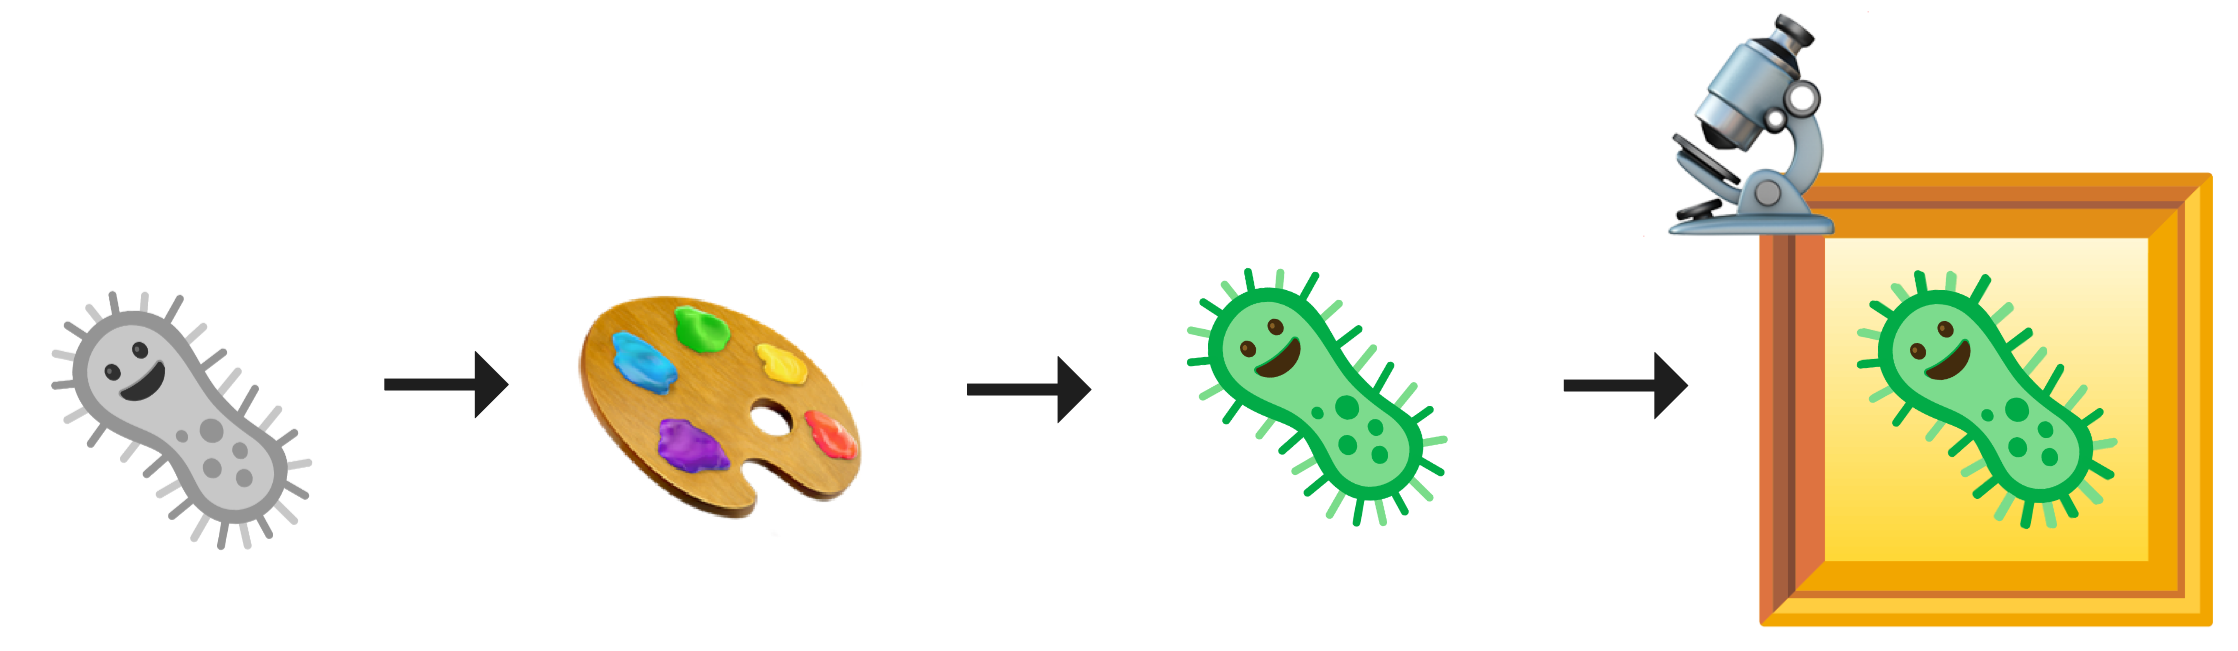
Figure 1. A microscope images cells to highlight cell processes. Often, fluorescence dyes stain the cells to mark specific proteins, compartments, and/or organelles.
CytoTable processes microscopy-based data that are created from multiple upstream steps (image analysis). CytoTable does not require any specific sample preparation, and can work with any microscopy experimental design. However, most often, CytoTable processes fluorescence microscopy images from the Cell Painting assay. In the Cell Painting assay, scientists stain cells with a panel of six fluorescent dyes that mark key cellular compartments and organelles, including the nucleus, nucleoli/RNA, endoplasmic reticulum, mitochondria, actin cytoskeleton, Golgi apparatus, and plasma membrane (Bray et al., 2016; Gustafsdottir et al., 2013). Scientists then use microscopes to image these cells across fluorescence channels, and use image analysis software to produce high-content morphology profiles of individual cells for downstream analysis .
We use the ExampleHuman dataset provided from CellProfiler Examples (Moffat et al., 2006, CellProfiler Examples Link) to describe this process below.
# display the images we will gather features from
image_name_map = {"d0.tif": "DNA", "d1.tif": "PH3", "d2.tif": "Cells"}

for image in pathlib.Path(source_path).glob("*.tif"):
    stain = ""
    for key, val in image_name_map.items():
        if key in str(image):
            stain = val
    print(f"\nImage with stain: {stain}")
    display(Image.open(image))
Image with stain: DNA
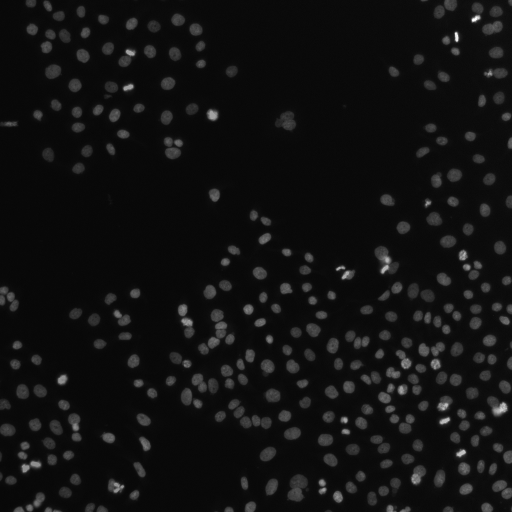
Image with stain: PH3
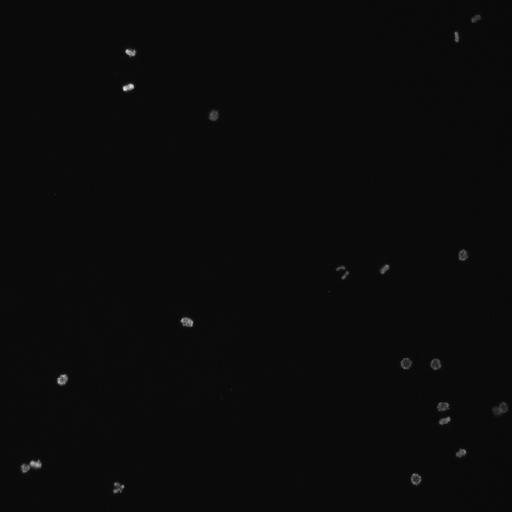
Image with stain: Cells
Phase 2: CellProfiler segments cells and measures numeric features
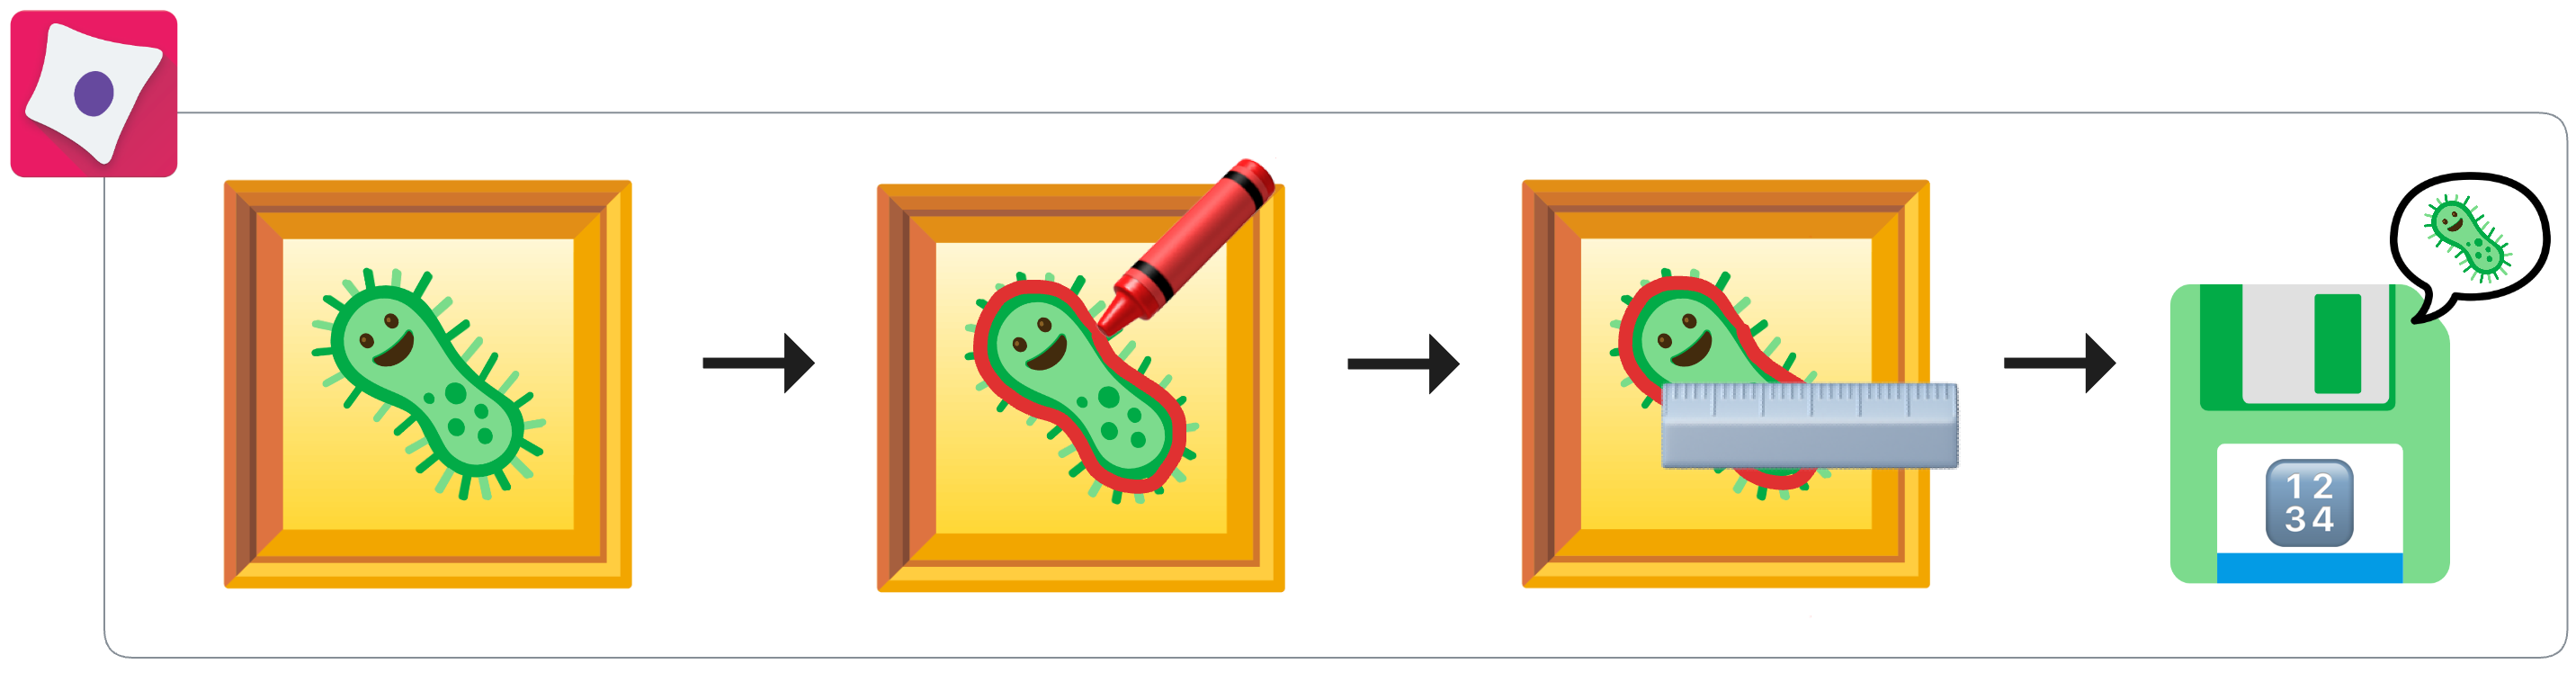
Figure 2. CellProfiler takes in microscopy images and performs single-cell segmentation to distinguish cells from background. CellProfiler then measures “hand-engineered” computer vision features from every single cell. These data are captured for later use in multiple CSV tables or SQLite database.
After acquisition, scientists process the images using image-analysis software such as CellProfiler. CellProfiler segments single cells and their biological compartments into distinct regions of interest. From these segmented cells, CellProfiler extracts hundreds to thousands of quantitative features per cell, capturing properties such as size, shape, intensity, texture, and spatial organization. These high-dimensional feature datasets provide a numerical representation of cell morphology that serves as the foundation for downstream profiling and analysis (Carpenter et al., 2006).
We use CellProfiler (with a prespecified configuration .cppipe file) to produce the following images and data tables from the ExampleHuman dataset.
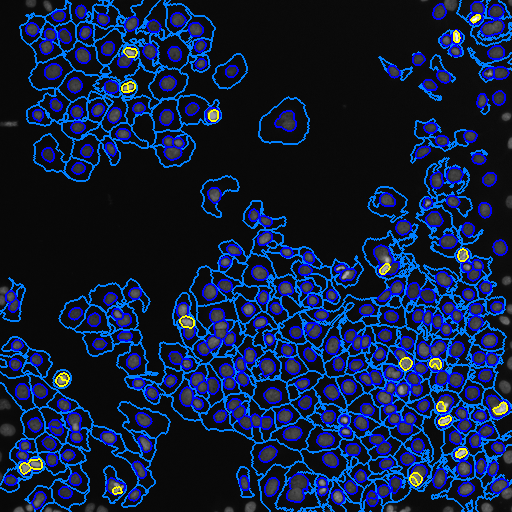
# show the segmentations through an overlay with outlines
for image in pathlib.Path(source_path).glob("*Overlay.png"):
    print(f"Image outlines from segmentation (composite)")
    print("Color key: (dark blue: nuclei, light blue: cells, yellow: PH3)")
    display(Image.open(image))
Image outlines from segmentation (composite)
Color key: (dark blue: nuclei, light blue: cells, yellow: PH3)
# show the tables generated from the resulting CSV files
for profiles in pathlib.Path(source_path).glob("*.csv"):
    print(f"\nProfiles from CellProfiler: {profiles}")
    display(pd.read_csv(profiles).head())
Profiles from CellProfiler: ../../../tests/data/cellprofiler/examplehuman/Experiment.csv
| Key | Value | |
|---|---|---|
| 0 | CellProfiler_Version | 4.0.6 |
| 1 | ChannelType_DNA | Grayscale |
| 2 | ChannelType_PH3 | Grayscale |
| 3 | ChannelType_cellbody | Grayscale |
| 4 | ImageSet_Zip_Dictionary | b'eG1sMS4wImNvP09NRXd3Lm9wLmhtL09NRS0+PEltYWdl... |
Profiles from CellProfiler: ../../../tests/data/cellprofiler/examplehuman/PH3.csv
| ImageNumber | ObjectNumber | Location_Center_X | Location_Center_Y | Location_Center_Z | Number_Object_Number | Parent_Nuclei | |
|---|---|---|---|---|---|---|---|
| 0 | 1 | 1 | 475.232558 | 18.162791 | 0 | 1 | 7 |
| 1 | 1 | 2 | 456.096154 | 36.326923 | 0 | 2 | 17 |
| 2 | 1 | 3 | 130.119565 | 51.967391 | 0 | 3 | 25 |
| 3 | 1 | 4 | 130.660714 | 85.982143 | 0 | 4 | 41 |
| 4 | 1 | 5 | 124.891304 | 87.913043 | 0 | 5 | 41 |
Profiles from CellProfiler: ../../../tests/data/cellprofiler/examplehuman/Cytoplasm.csv
| ImageNumber | ObjectNumber | AreaShape_Area | AreaShape_BoundingBoxArea | AreaShape_BoundingBoxMaximum_X | AreaShape_BoundingBoxMaximum_Y | AreaShape_BoundingBoxMinimum_X | AreaShape_BoundingBoxMinimum_Y | AreaShape_Center_X | AreaShape_Center_Y | ... | Location_Center_Y | Location_MaxIntensity_X_DNA | Location_MaxIntensity_X_PH3 | Location_MaxIntensity_Y_DNA | Location_MaxIntensity_Y_PH3 | Location_MaxIntensity_Z_DNA | Location_MaxIntensity_Z_PH3 | Number_Object_Number | Parent_Cells | Parent_Nuclei | |
|---|---|---|---|---|---|---|---|---|---|---|---|---|---|---|---|---|---|---|---|---|---|
| 0 | 1 | 1 | 288 | 580 | 486 | 20 | 457 | 0 | 468.621528 | 7.739583 | ... | 7.739583 | 478.0 | 478.0 | 12.0 | 13.0 | 0.0 | 0.0 | 1 | 1 | 1 |
| 1 | 1 | 2 | 256 | 475 | 511 | 19 | 486 | 0 | 496.113281 | 9.058594 | ... | 9.058594 | 493.0 | 503.0 | 16.0 | 16.0 | 0.0 | 0.0 | 2 | 2 | 2 |
| 2 | 1 | 3 | 52 | 195 | 446 | 19 | 433 | 4 | 439.000000 | 11.269231 | ... | 11.269231 | 443.0 | 433.0 | 8.0 | 12.0 | 0.0 | 0.0 | 3 | 3 | 3 |
| 3 | 1 | 4 | 466 | 972 | 103 | 27 | 67 | 0 | 81.849785 | 9.175966 | ... | 9.175966 | 83.0 | 73.0 | 15.0 | 19.0 | 0.0 | 0.0 | 4 | 4 | 4 |
| 4 | 1 | 5 | 296 | 729 | 72 | 27 | 45 | 0 | 59.597973 | 15.952703 | ... | 15.952703 | 62.0 | 66.0 | 12.0 | 0.0 | 0.0 | 0.0 | 5 | 5 | 5 |
5 rows × 103 columns
Profiles from CellProfiler: ../../../tests/data/cellprofiler/examplehuman/Image.csv
| Channel_DNA | Channel_PH3 | Channel_cellbody | Count_Cells | Count_Cytoplasm | Count_Nuclei | Count_PH3 | ExecutionTime_01Images | ExecutionTime_02Metadata | ExecutionTime_03NamesAndTypes | ... | Threshold_WeightedVariance_Cells | Threshold_WeightedVariance_Nuclei | Threshold_WeightedVariance_PH3 | URL_DNA | URL_OrigOverlay | URL_PH3 | URL_cellbody | Width_DNA | Width_PH3 | Width_cellbody | |
|---|---|---|---|---|---|---|---|---|---|---|---|---|---|---|---|---|---|---|---|---|---|
| 0 | -1 | -1 | -1 | 289.0 | 289.0 | 289.0 | 22.0 | 0.0 | 0.0 | 5.08 | ... | 0.334916 | 0.130342 | 0.018841 | file:/usr/local/src/ExampleHuman/images/AS_091... | file:output/ExampleHuman/AS_09125_050116030001... | file:/usr/local/src/ExampleHuman/images/AS_091... | file:/usr/local/src/ExampleHuman/images/AS_091... | 512 | 512 | 512 |
1 rows × 81 columns
Profiles from CellProfiler: ../../../tests/data/cellprofiler/examplehuman/Nuclei.csv
| ImageNumber | ObjectNumber | AreaShape_Area | AreaShape_BoundingBoxArea | AreaShape_BoundingBoxMaximum_X | AreaShape_BoundingBoxMaximum_Y | AreaShape_BoundingBoxMinimum_X | AreaShape_BoundingBoxMinimum_Y | AreaShape_Center_X | AreaShape_Center_Y | ... | Location_Center_X | Location_Center_Y | Location_Center_Z | Location_MaxIntensity_X_DNA | Location_MaxIntensity_X_PH3 | Location_MaxIntensity_Y_DNA | Location_MaxIntensity_Y_PH3 | Location_MaxIntensity_Z_DNA | Location_MaxIntensity_Z_PH3 | Number_Object_Number | |
|---|---|---|---|---|---|---|---|---|---|---|---|---|---|---|---|---|---|---|---|---|---|
| 0 | 1 | 1 | 131 | 156 | 484 | 14 | 471 | 2 | 477.099237 | 7.580153 | ... | 477.099237 | 7.580153 | 0 | 477.0 | 478.0 | 8.0 | 13.0 | 0.0 | 0.0 | 1 |
| 1 | 1 | 2 | 152 | 195 | 504 | 18 | 489 | 5 | 495.750000 | 11.098684 | ... | 495.750000 | 11.098684 | 0 | 495.0 | 502.0 | 9.0 | 14.0 | 0.0 | 0.0 | 2 |
| 2 | 1 | 3 | 147 | 195 | 446 | 19 | 433 | 4 | 438.959184 | 11.374150 | ... | 438.959184 | 11.374150 | 0 | 440.0 | 439.0 | 11.0 | 16.0 | 0.0 | 0.0 | 3 |
| 3 | 1 | 4 | 98 | 130 | 86 | 18 | 76 | 5 | 80.459184 | 11.163265 | ... | 80.459184 | 11.163265 | 0 | 80.0 | 81.0 | 13.0 | 10.0 | 0.0 | 0.0 | 4 |
| 4 | 1 | 5 | 104 | 130 | 65 | 21 | 52 | 11 | 58.423077 | 15.509615 | ... | 58.423077 | 15.509615 | 0 | 62.0 | 52.0 | 14.0 | 15.0 | 0.0 | 0.0 | 5 |
5 rows × 105 columns
Profiles from CellProfiler: ../../../tests/data/cellprofiler/examplehuman/Cells.csv
| ImageNumber | ObjectNumber | AreaShape_Area | AreaShape_BoundingBoxArea | AreaShape_BoundingBoxMaximum_X | AreaShape_BoundingBoxMaximum_Y | AreaShape_BoundingBoxMinimum_X | AreaShape_BoundingBoxMinimum_Y | AreaShape_Center_X | AreaShape_Center_Y | ... | Location_Center_Y | Location_Center_Z | Location_MaxIntensity_X_DNA | Location_MaxIntensity_X_PH3 | Location_MaxIntensity_Y_DNA | Location_MaxIntensity_Y_PH3 | Location_MaxIntensity_Z_DNA | Location_MaxIntensity_Z_PH3 | Number_Object_Number | Parent_Nuclei | |
|---|---|---|---|---|---|---|---|---|---|---|---|---|---|---|---|---|---|---|---|---|---|
| 0 | 1 | 1 | 372 | 580 | 486 | 20 | 457 | 0 | 470.543011 | 7.693548 | ... | 7.693548 | 0 | 477.0 | 479.0 | 8.0 | 13.0 | 0.0 | 0.0 | 1 | 1 |
| 1 | 1 | 2 | 356 | 475 | 511 | 19 | 486 | 0 | 495.994382 | 9.632022 | ... | 9.632022 | 0 | 495.0 | 497.0 | 9.0 | 3.0 | 0.0 | 0.0 | 2 | 2 |
| 2 | 1 | 3 | 147 | 195 | 446 | 19 | 433 | 4 | 438.959184 | 11.374150 | ... | 11.374150 | 0 | 440.0 | 435.0 | 11.0 | 8.0 | 0.0 | 0.0 | 3 | 3 |
| 3 | 1 | 4 | 523 | 972 | 103 | 27 | 67 | 0 | 81.695985 | 9.391969 | ... | 9.391969 | 0 | 80.0 | 86.0 | 13.0 | 7.0 | 0.0 | 0.0 | 4 | 4 |
| 4 | 1 | 5 | 358 | 729 | 72 | 27 | 45 | 0 | 59.416201 | 15.877095 | ... | 15.877095 | 0 | 61.0 | 66.0 | 14.0 | 0.0 | 0.0 | 0.0 | 5 | 5 |
5 rows × 104 columns
Phase 3: CytoTable harmonizes the feature datasets that CellProfiler generates
CellProfiler produces high-dimensional feature tables that vary in format depending on the imaging pipeline, experiment, or storage system. Sometimes these feature tables are thousands of columns and hundreds of thousands of rows. CytoTable harmonizes these outputs into consistent, analysis-ready formats such as Parquet or AnnData. This unification ensures that data from diverse experiments can be readily integrated and processed by downstream profiling tools like Pycytominer or coSMicQC, enabling scalable and reproducible bioinformatics workflows.
We use CytoTable below to process the numeric feature data we generated above.
%%time

# run cytotable convert
result = cytotable.convert(
    source_path=source_path,
    dest_path=dest_path,
    # specify a destination data format type
    dest_datatype="parquet",
    # specify a preset which enables quick use of common input file formats
    preset="cellprofiler_csv",
)
print(pathlib.Path(result).name)
example.parquet
CPU times: user 239 ms, sys: 167 ms, total: 406 ms
Wall time: 13.3 s
# show the table head using pandas
pq.read_table(source=result).to_pandas().head()
| Metadata_ImageNumber | Metadata_Cells_Parent_Nuclei | Metadata_Cytoplasm_Parent_Cells | Metadata_Cytoplasm_Parent_Nuclei | Metadata_ObjectNumber | Image_FileName_DNA | Image_FileName_OrigOverlay | Image_FileName_PH3 | Image_FileName_cellbody | Cytoplasm_AreaShape_Area | ... | Nuclei_Location_Center_X | Nuclei_Location_Center_Y | Nuclei_Location_Center_Z | Nuclei_Location_MaxIntensity_X_DNA | Nuclei_Location_MaxIntensity_X_PH3 | Nuclei_Location_MaxIntensity_Y_DNA | Nuclei_Location_MaxIntensity_Y_PH3 | Nuclei_Location_MaxIntensity_Z_DNA | Nuclei_Location_MaxIntensity_Z_PH3 | Nuclei_Number_Object_Number | |
|---|---|---|---|---|---|---|---|---|---|---|---|---|---|---|---|---|---|---|---|---|---|
| 0 | 1 | 1 | 1 | 1 | 1 | AS_09125_050116030001_D03f00d0.tif | AS_09125_050116030001_D03f00d0_Overlay.png | AS_09125_050116030001_D03f00d1.tif | AS_09125_050116030001_D03f00d2.tif | 288 | ... | 477.099237 | 7.580153 | 0 | 477.0 | 478.0 | 8.0 | 13.0 | 0.0 | 0.0 | 1 |
| 1 | 1 | 2 | 2 | 2 | 2 | AS_09125_050116030001_D03f00d0.tif | AS_09125_050116030001_D03f00d0_Overlay.png | AS_09125_050116030001_D03f00d1.tif | AS_09125_050116030001_D03f00d2.tif | 256 | ... | 495.750000 | 11.098684 | 0 | 495.0 | 502.0 | 9.0 | 14.0 | 0.0 | 0.0 | 2 |
| 2 | 1 | 3 | 3 | 3 | 3 | AS_09125_050116030001_D03f00d0.tif | AS_09125_050116030001_D03f00d0_Overlay.png | AS_09125_050116030001_D03f00d1.tif | AS_09125_050116030001_D03f00d2.tif | 52 | ... | 438.959184 | 11.374150 | 0 | 440.0 | 439.0 | 11.0 | 16.0 | 0.0 | 0.0 | 3 |
| 3 | 1 | 4 | 4 | 4 | 4 | AS_09125_050116030001_D03f00d0.tif | AS_09125_050116030001_D03f00d0_Overlay.png | AS_09125_050116030001_D03f00d1.tif | AS_09125_050116030001_D03f00d2.tif | 466 | ... | 80.459184 | 11.163265 | 0 | 80.0 | 81.0 | 13.0 | 10.0 | 0.0 | 0.0 | 4 |
| 4 | 1 | 5 | 5 | 5 | 5 | AS_09125_050116030001_D03f00d0.tif | AS_09125_050116030001_D03f00d0_Overlay.png | AS_09125_050116030001_D03f00d1.tif | AS_09125_050116030001_D03f00d2.tif | 296 | ... | 58.423077 | 15.509615 | 0 | 62.0 | 52.0 | 14.0 | 15.0 | 0.0 | 0.0 | 5 |
5 rows × 312 columns
# show metadata for the result file
pq.read_metadata(result)
<pyarrow._parquet.FileMetaData object at 0x1762a7dd0>
  created_by: parquet-cpp-arrow version 21.0.0
  num_columns: 312
  num_rows: 289
  num_row_groups: 1
  format_version: 2.6
  serialized_size: 87761
# show schema metadata which includes CytoTable information
# note: this information will travel with the file.
pq.read_schema(result).metadata
{b'data-producer': b'https://github.com/cytomining/CytoTable',
 b'data-producer-version': b'1.1.0.post13.dev0+2f51ec3'}
# show schema column name summaries
print("Column name prefix counts:")
dict(Counter(w.split("_", 1)[0] for w in pq.read_schema(result).names))
Column name prefix counts:
{'Metadata': 5, 'Image': 4, 'Cytoplasm': 99, 'Cells': 101, 'Nuclei': 103}
# show full schema details
pq.read_schema(result)
Metadata_ImageNumber: int64
Metadata_Cells_Parent_Nuclei: int64
Metadata_Cytoplasm_Parent_Cells: int64
Metadata_Cytoplasm_Parent_Nuclei: int64
Metadata_ObjectNumber: int64
Image_FileName_DNA: string
Image_FileName_OrigOverlay: string
Image_FileName_PH3: string
Image_FileName_cellbody: string
Cytoplasm_AreaShape_Area: int64
Cytoplasm_AreaShape_BoundingBoxArea: int64
Cytoplasm_AreaShape_BoundingBoxMaximum_X: int64
Cytoplasm_AreaShape_BoundingBoxMaximum_Y: int64
Cytoplasm_AreaShape_BoundingBoxMinimum_X: int64
Cytoplasm_AreaShape_BoundingBoxMinimum_Y: int64
Cytoplasm_AreaShape_Center_X: double
Cytoplasm_AreaShape_Center_Y: double
Cytoplasm_AreaShape_Compactness: double
Cytoplasm_AreaShape_Eccentricity: double
Cytoplasm_AreaShape_EquivalentDiameter: double
Cytoplasm_AreaShape_EulerNumber: int64
Cytoplasm_AreaShape_Extent: double
Cytoplasm_AreaShape_FormFactor: double
Cytoplasm_AreaShape_MajorAxisLength: double
Cytoplasm_AreaShape_MaxFeretDiameter: double
Cytoplasm_AreaShape_MaximumRadius: double
Cytoplasm_AreaShape_MeanRadius: double
Cytoplasm_AreaShape_MedianRadius: double
Cytoplasm_AreaShape_MinFeretDiameter: double
Cytoplasm_AreaShape_MinorAxisLength: double
Cytoplasm_AreaShape_Orientation: double
Cytoplasm_AreaShape_Perimeter: double
Cytoplasm_AreaShape_Solidity: double
Cytoplasm_AreaShape_Zernike_0_0: double
Cytoplasm_AreaShape_Zernike_1_1: double
Cytoplasm_AreaShape_Zernike_2_0: double
Cytoplasm_AreaShape_Zernike_2_2: double
Cytoplasm_AreaShape_Zernike_3_1: double
Cytoplasm_AreaShape_Zernike_3_3: double
Cytoplasm_AreaShape_Zernike_4_0: double
Cytoplasm_AreaShape_Zernike_4_2: double
Cytoplasm_AreaShape_Zernike_4_4: double
Cytoplasm_AreaShape_Zernike_5_1: double
Cytoplasm_AreaShape_Zernike_5_3: double
Cytoplasm_AreaShape_Zernike_5_5: double
Cytoplasm_AreaShape_Zernike_6_0: double
Cytoplasm_AreaShape_Zernike_6_2: double
Cytoplasm_AreaShape_Zernike_6_4: double
Cytoplasm_AreaShape_Zernike_6_6: double
Cytoplasm_AreaShape_Zernike_7_1: double
Cytoplasm_AreaShape_Zernike_7_3: double
Cytoplasm_AreaShape_Zernike_7_5: double
Cytoplasm_AreaShape_Zernike_7_7: double
Cytoplasm_AreaShape_Zernike_8_0: double
Cytoplasm_AreaShape_Zernike_8_2: double
Cytoplasm_AreaShape_Zernike_8_4: double
Cytoplasm_AreaShape_Zernike_8_6: double
Cytoplasm_AreaShape_Zernike_8_8: double
Cytoplasm_AreaShape_Zernike_9_1: double
Cytoplasm_AreaShape_Zernike_9_3: double
Cytoplasm_AreaShape_Zernike_9_5: double
Cytoplasm_AreaShape_Zernike_9_7: double
Cytoplasm_AreaShape_Zernike_9_9: double
Cytoplasm_Intensity_IntegratedIntensityEdge_DNA: double
Cytoplasm_Intensity_IntegratedIntensityEdge_PH3: double
Cytoplasm_Intensity_IntegratedIntensity_DNA: double
Cytoplasm_Intensity_IntegratedIntensity_PH3: double
Cytoplasm_Intensity_LowerQuartileIntensity_DNA: double
Cytoplasm_Intensity_LowerQuartileIntensity_PH3: double
Cytoplasm_Intensity_MADIntensity_DNA: double
Cytoplasm_Intensity_MADIntensity_PH3: double
Cytoplasm_Intensity_MassDisplacement_DNA: double
Cytoplasm_Intensity_MassDisplacement_PH3: double
Cytoplasm_Intensity_MaxIntensityEdge_DNA: double
Cytoplasm_Intensity_MaxIntensityEdge_PH3: double
Cytoplasm_Intensity_MaxIntensity_DNA: double
Cytoplasm_Intensity_MaxIntensity_PH3: double
Cytoplasm_Intensity_MeanIntensityEdge_DNA: double
Cytoplasm_Intensity_MeanIntensityEdge_PH3: double
Cytoplasm_Intensity_MeanIntensity_DNA: double
Cytoplasm_Intensity_MeanIntensity_PH3: double
Cytoplasm_Intensity_MedianIntensity_DNA: double
Cytoplasm_Intensity_MedianIntensity_PH3: double
Cytoplasm_Intensity_MinIntensityEdge_DNA: double
Cytoplasm_Intensity_MinIntensityEdge_PH3: double
Cytoplasm_Intensity_MinIntensity_DNA: double
Cytoplasm_Intensity_MinIntensity_PH3: double
Cytoplasm_Intensity_StdIntensityEdge_DNA: double
Cytoplasm_Intensity_StdIntensityEdge_PH3: double
Cytoplasm_Intensity_StdIntensity_DNA: double
Cytoplasm_Intensity_StdIntensity_PH3: double
Cytoplasm_Intensity_UpperQuartileIntensity_DNA: double
Cytoplasm_Intensity_UpperQuartileIntensity_PH3: double
Cytoplasm_Location_CenterMassIntensity_X_DNA: double
Cytoplasm_Location_CenterMassIntensity_X_PH3: double
Cytoplasm_Location_CenterMassIntensity_Y_DNA: double
Cytoplasm_Location_CenterMassIntensity_Y_PH3: double
Cytoplasm_Location_CenterMassIntensity_Z_DNA: double
Cytoplasm_Location_CenterMassIntensity_Z_PH3: double
Cytoplasm_Location_Center_X: double
Cytoplasm_Location_Center_Y: double
Cytoplasm_Location_MaxIntensity_X_DNA: double
Cytoplasm_Location_MaxIntensity_X_PH3: double
Cytoplasm_Location_MaxIntensity_Y_DNA: double
Cytoplasm_Location_MaxIntensity_Y_PH3: double
Cytoplasm_Location_MaxIntensity_Z_DNA: double
Cytoplasm_Location_MaxIntensity_Z_PH3: double
Cytoplasm_Number_Object_Number: int64
Cells_AreaShape_Area: int64
Cells_AreaShape_BoundingBoxArea: int64
Cells_AreaShape_BoundingBoxMaximum_X: int64
Cells_AreaShape_BoundingBoxMaximum_Y: int64
Cells_AreaShape_BoundingBoxMinimum_X: int64
Cells_AreaShape_BoundingBoxMinimum_Y: int64
Cells_AreaShape_Center_X: double
Cells_AreaShape_Center_Y: double
Cells_AreaShape_Compactness: double
Cells_AreaShape_Eccentricity: double
Cells_AreaShape_EquivalentDiameter: double
Cells_AreaShape_EulerNumber: int64
Cells_AreaShape_Extent: double
Cells_AreaShape_FormFactor: double
Cells_AreaShape_MajorAxisLength: double
Cells_AreaShape_MaxFeretDiameter: double
Cells_AreaShape_MaximumRadius: double
Cells_AreaShape_MeanRadius: double
Cells_AreaShape_MedianRadius: double
Cells_AreaShape_MinFeretDiameter: double
Cells_AreaShape_MinorAxisLength: double
Cells_AreaShape_Orientation: double
Cells_AreaShape_Perimeter: double
Cells_AreaShape_Solidity: double
Cells_AreaShape_Zernike_0_0: double
Cells_AreaShape_Zernike_1_1: double
Cells_AreaShape_Zernike_2_0: double
Cells_AreaShape_Zernike_2_2: double
Cells_AreaShape_Zernike_3_1: double
Cells_AreaShape_Zernike_3_3: double
Cells_AreaShape_Zernike_4_0: double
Cells_AreaShape_Zernike_4_2: double
Cells_AreaShape_Zernike_4_4: double
Cells_AreaShape_Zernike_5_1: double
Cells_AreaShape_Zernike_5_3: double
Cells_AreaShape_Zernike_5_5: double
Cells_AreaShape_Zernike_6_0: double
Cells_AreaShape_Zernike_6_2: double
Cells_AreaShape_Zernike_6_4: double
Cells_AreaShape_Zernike_6_6: double
Cells_AreaShape_Zernike_7_1: double
Cells_AreaShape_Zernike_7_3: double
Cells_AreaShape_Zernike_7_5: double
Cells_AreaShape_Zernike_7_7: double
Cells_AreaShape_Zernike_8_0: double
Cells_AreaShape_Zernike_8_2: double
Cells_AreaShape_Zernike_8_4: double
Cells_AreaShape_Zernike_8_6: double
Cells_AreaShape_Zernike_8_8: double
Cells_AreaShape_Zernike_9_1: double
Cells_AreaShape_Zernike_9_3: double
Cells_AreaShape_Zernike_9_5: double
Cells_AreaShape_Zernike_9_7: double
Cells_AreaShape_Zernike_9_9: double
Cells_Children_Cytoplasm_Count: int64
Cells_Intensity_IntegratedIntensityEdge_DNA: double
Cells_Intensity_IntegratedIntensityEdge_PH3: double
Cells_Intensity_IntegratedIntensity_DNA: double
Cells_Intensity_IntegratedIntensity_PH3: double
Cells_Intensity_LowerQuartileIntensity_DNA: double
Cells_Intensity_LowerQuartileIntensity_PH3: double
Cells_Intensity_MADIntensity_DNA: double
Cells_Intensity_MADIntensity_PH3: double
Cells_Intensity_MassDisplacement_DNA: double
Cells_Intensity_MassDisplacement_PH3: double
Cells_Intensity_MaxIntensityEdge_DNA: double
Cells_Intensity_MaxIntensityEdge_PH3: double
Cells_Intensity_MaxIntensity_DNA: double
Cells_Intensity_MaxIntensity_PH3: double
Cells_Intensity_MeanIntensityEdge_DNA: double
Cells_Intensity_MeanIntensityEdge_PH3: double
Cells_Intensity_MeanIntensity_DNA: double
Cells_Intensity_MeanIntensity_PH3: double
Cells_Intensity_MedianIntensity_DNA: double
Cells_Intensity_MedianIntensity_PH3: double
Cells_Intensity_MinIntensityEdge_DNA: double
Cells_Intensity_MinIntensityEdge_PH3: double
Cells_Intensity_MinIntensity_DNA: double
Cells_Intensity_MinIntensity_PH3: double
Cells_Intensity_StdIntensityEdge_DNA: double
Cells_Intensity_StdIntensityEdge_PH3: double
Cells_Intensity_StdIntensity_DNA: double
Cells_Intensity_StdIntensity_PH3: double
Cells_Intensity_UpperQuartileIntensity_DNA: double
Cells_Intensity_UpperQuartileIntensity_PH3: double
Cells_Location_CenterMassIntensity_X_DNA: double
Cells_Location_CenterMassIntensity_X_PH3: double
Cells_Location_CenterMassIntensity_Y_DNA: double
Cells_Location_CenterMassIntensity_Y_PH3: double
Cells_Location_CenterMassIntensity_Z_DNA: double
Cells_Location_CenterMassIntensity_Z_PH3: double
Cells_Location_Center_X: double
Cells_Location_Center_Y: double
Cells_Location_Center_Z: int64
Cells_Location_MaxIntensity_X_DNA: double
Cells_Location_MaxIntensity_X_PH3: double
Cells_Location_MaxIntensity_Y_DNA: double
Cells_Location_MaxIntensity_Y_PH3: double
Cells_Location_MaxIntensity_Z_DNA: double
Cells_Location_MaxIntensity_Z_PH3: double
Cells_Number_Object_Number: int64
Nuclei_AreaShape_Area: int64
Nuclei_AreaShape_BoundingBoxArea: int64
Nuclei_AreaShape_BoundingBoxMaximum_X: int64
Nuclei_AreaShape_BoundingBoxMaximum_Y: int64
Nuclei_AreaShape_BoundingBoxMinimum_X: int64
Nuclei_AreaShape_BoundingBoxMinimum_Y: int64
Nuclei_AreaShape_Center_X: double
Nuclei_AreaShape_Center_Y: double
Nuclei_AreaShape_Compactness: double
Nuclei_AreaShape_Eccentricity: double
Nuclei_AreaShape_EquivalentDiameter: double
Nuclei_AreaShape_EulerNumber: int64
Nuclei_AreaShape_Extent: double
Nuclei_AreaShape_FormFactor: double
Nuclei_AreaShape_MajorAxisLength: double
Nuclei_AreaShape_MaxFeretDiameter: double
Nuclei_AreaShape_MaximumRadius: double
Nuclei_AreaShape_MeanRadius: double
Nuclei_AreaShape_MedianRadius: double
Nuclei_AreaShape_MinFeretDiameter: double
Nuclei_AreaShape_MinorAxisLength: double
Nuclei_AreaShape_Orientation: double
Nuclei_AreaShape_Perimeter: double
Nuclei_AreaShape_Solidity: double
Nuclei_AreaShape_Zernike_0_0: double
Nuclei_AreaShape_Zernike_1_1: double
Nuclei_AreaShape_Zernike_2_0: double
Nuclei_AreaShape_Zernike_2_2: double
Nuclei_AreaShape_Zernike_3_1: double
Nuclei_AreaShape_Zernike_3_3: double
Nuclei_AreaShape_Zernike_4_0: double
Nuclei_AreaShape_Zernike_4_2: double
Nuclei_AreaShape_Zernike_4_4: double
Nuclei_AreaShape_Zernike_5_1: double
Nuclei_AreaShape_Zernike_5_3: double
Nuclei_AreaShape_Zernike_5_5: double
Nuclei_AreaShape_Zernike_6_0: double
Nuclei_AreaShape_Zernike_6_2: double
Nuclei_AreaShape_Zernike_6_4: double
Nuclei_AreaShape_Zernike_6_6: double
Nuclei_AreaShape_Zernike_7_1: double
Nuclei_AreaShape_Zernike_7_3: double
Nuclei_AreaShape_Zernike_7_5: double
Nuclei_AreaShape_Zernike_7_7: double
Nuclei_AreaShape_Zernike_8_0: double
Nuclei_AreaShape_Zernike_8_2: double
Nuclei_AreaShape_Zernike_8_4: double
Nuclei_AreaShape_Zernike_8_6: double
Nuclei_AreaShape_Zernike_8_8: double
Nuclei_AreaShape_Zernike_9_1: double
Nuclei_AreaShape_Zernike_9_3: double
Nuclei_AreaShape_Zernike_9_5: double
Nuclei_AreaShape_Zernike_9_7: double
Nuclei_AreaShape_Zernike_9_9: double
Nuclei_Children_Cells_Count: int64
Nuclei_Children_Cytoplasm_Count: int64
Nuclei_Children_PH3_Count: int64
Nuclei_Intensity_IntegratedIntensityEdge_DNA: double
Nuclei_Intensity_IntegratedIntensityEdge_PH3: double
Nuclei_Intensity_IntegratedIntensity_DNA: double
Nuclei_Intensity_IntegratedIntensity_PH3: double
Nuclei_Intensity_LowerQuartileIntensity_DNA: double
Nuclei_Intensity_LowerQuartileIntensity_PH3: double
Nuclei_Intensity_MADIntensity_DNA: double
Nuclei_Intensity_MADIntensity_PH3: double
Nuclei_Intensity_MassDisplacement_DNA: double
Nuclei_Intensity_MassDisplacement_PH3: double
Nuclei_Intensity_MaxIntensityEdge_DNA: double
Nuclei_Intensity_MaxIntensityEdge_PH3: double
Nuclei_Intensity_MaxIntensity_DNA: double
Nuclei_Intensity_MaxIntensity_PH3: double
Nuclei_Intensity_MeanIntensityEdge_DNA: double
Nuclei_Intensity_MeanIntensityEdge_PH3: double
Nuclei_Intensity_MeanIntensity_DNA: double
Nuclei_Intensity_MeanIntensity_PH3: double
Nuclei_Intensity_MedianIntensity_DNA: double
Nuclei_Intensity_MedianIntensity_PH3: double
Nuclei_Intensity_MinIntensityEdge_DNA: double
Nuclei_Intensity_MinIntensityEdge_PH3: double
Nuclei_Intensity_MinIntensity_DNA: double
Nuclei_Intensity_MinIntensity_PH3: double
Nuclei_Intensity_StdIntensityEdge_DNA: double
Nuclei_Intensity_StdIntensityEdge_PH3: double
Nuclei_Intensity_StdIntensity_DNA: double
Nuclei_Intensity_StdIntensity_PH3: double
Nuclei_Intensity_UpperQuartileIntensity_DNA: double
Nuclei_Intensity_UpperQuartileIntensity_PH3: double
Nuclei_Location_CenterMassIntensity_X_DNA: double
Nuclei_Location_CenterMassIntensity_X_PH3: double
Nuclei_Location_CenterMassIntensity_Y_DNA: double
Nuclei_Location_CenterMassIntensity_Y_PH3: double
Nuclei_Location_CenterMassIntensity_Z_DNA: double
Nuclei_Location_CenterMassIntensity_Z_PH3: double
Nuclei_Location_Center_X: double
Nuclei_Location_Center_Y: double
Nuclei_Location_Center_Z: int64
Nuclei_Location_MaxIntensity_X_DNA: double
Nuclei_Location_MaxIntensity_X_PH3: double
Nuclei_Location_MaxIntensity_Y_DNA: double
Nuclei_Location_MaxIntensity_Y_PH3: double
Nuclei_Location_MaxIntensity_Z_DNA: double
Nuclei_Location_MaxIntensity_Z_PH3: double
Nuclei_Number_Object_Number: int64
-- schema metadata --
data-producer: 'https://github.com/cytomining/CytoTable'
data-producer-version: '1.1.0.post13.dev0+2f51ec3'